
A speed test displays three figures: download speed, upload speed, and latency, after which the user closes the tab. The problem is that these results vary from test to test, sometimes doubling in just a few minutes. Understanding where these discrepancies come from and knowing how to reduce them is the difference between a reliable diagnosis and a useless number.
4-pair Ethernet cable and CPU load: two blind spots in speed testing
Most guides recommend connecting an Ethernet cable to test the speed. Few specify that not all Ethernet cables are created equal. According to technical recommendations published by Arcep, a 4-wire (two pairs) cable tops out at 100 Mbit/s, even on a fiber line capable of much more. Only an 8-wire (four pairs) cable can reach 1 Gbit/s.
Checking the cable takes a few seconds: just look at the RJ45 connector and count the visible metal contacts. Eight contacts mean four pairs, thus a Gigabit-compatible cable. Four contacts, and the test will be throttled before it even starts.
The other variable rarely mentioned is the CPU load of the computer during the measurement. Arcep recommends monitoring CPU usage in real-time and not exceeding about 70% load. Beyond that, the processor becomes the bottleneck, not the connection. On Windows, the task manager displays this information; on macOS, the activity monitor serves the same purpose. If the CPU saturates during the test, the measured speed does not reflect the actual capacity of the link.
To learn how to analyze internet bandwidth under good conditions, these two hardware prerequisites (suitable cable and available CPU) form the minimal foundation.
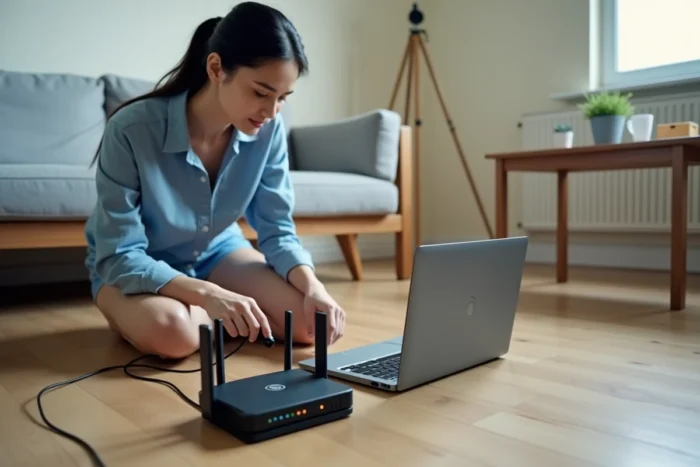
Online speed test or iperf3: what each tool actually measures
Tools like Ookla’s Speedtest, nPerf, or Cloudflare’s speed test measure the speed between your device and a remote server. The result thus depends on the distance to the selected server, the load on that server, and all the network nodes traversed between the two points.
This is useful for assessing the overall performance of the internet connection. However, this type of measurement does not allow for locating an internal problem within the home network.
Testing the local network with iperf3
The iperf3 tool, free and available on Windows, macOS, and Linux, works differently. It measures the speed between two machines located on the same local network, without going through the internet. One computer acts as a server, the other as a client.
- If the wired iperf3 speed reaches the theoretical capacity of the link (close to Gigabit on a properly wired network), the local network is not at fault. The problem, if it exists, lies with the service provider or on the internet path.
- If the Wi-Fi iperf3 speed is significantly lower than the wired speed, the gap precisely quantifies the loss due to wireless: interference, distance to the router, load-bearing walls, or limitations of the Wi-Fi standard used.
- If the speed is low even in wired mode between two local machines, the switch, cabling, or network card of one of the stations is at fault, and no change in ISP will fix that.
Differentiating the limit of the local network from that of the internet connection is the only way to make a diagnosis that leads to relevant corrective action.
Wi-Fi: why speed varies by room and time
A Wi-Fi test conducted one meter from the router and another performed two rooms away yield radically different results. TP-Link guides remind us of a often overlooked point: the testing device must be positioned at the same height as the router’s antenna, and both must be aligned. Poor alignment skews the measurement.
Neighboring Wi-Fi networks are a major source of interference, particularly on the 2.4 GHz band. Wi-Fi analysis tools (sometimes integrated into the router’s interface) allow you to visualize occupied channels and switch to a less congested one.
Comparing wired and Wi-Fi on the same router
The most reliable method is to connect one computer to the router via Ethernet cable and another via Wi-Fi, then run a simultaneous or consecutive test. The difference in speed between the two measurements isolates the loss attributable to wireless.
Field reports vary on this point depending on the hardware used. A Wi-Fi 6 router on the 5 GHz band with a compatible device will show a modest gap. A Wi-Fi 4 router on the 2.4 GHz band in a dense building will show a considerable divide. The Wi-Fi protocol and frequency band matter as much as the quality of the line.

Latency and jitter: metrics that speed alone does not show
A high speed does not guarantee a smooth connection. Latency (the round-trip time of a data packet) and jitter (variation of this latency over time) determine the perceived quality, especially in video conferencing or online gaming.
A classic speed test displays latency, often referred to as “ping.” Few measure jitter. The available data do not allow for setting a universal acceptable jitter threshold, as tolerance depends on the application used. However, high jitter indicates network instability that average speed does not reveal.
To monitor latency over time, the ping command (available on all operating systems) sent to a stable server for several minutes produces a series of measurements. The gap between the minimum and maximum values gives an indication of jitter.
Measuring speed remains the initial reflex, and that makes sense. Complementing this measurement with a latency test and stability check transforms a simple number into an actionable diagnosis. The next time a speed test displays a disappointing result, the useful question is not “what speed did I get,” but “where is the bottleneck”: cable, CPU, Wi-Fi, local network, or ISP connection.